Editorial notice: The following text is written by Nicolas Kayser-Bril, a french journalist and a pioneer in advanced data journalism. Some of his projects are highly relevant for the digital history community and we are very glad to have Nicolas presenting his new project here at hist.net! You can contact Nicolas at nkb@jplusplus.org. (ph)
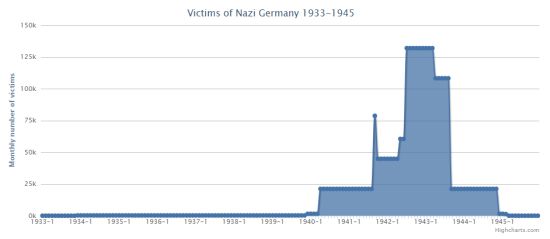
A few weeks back, I read that the number of people killed by Nazi Germany before 1939 was, at most, in the low 5 figures. I was struck by the number, as I thought that the intensity of horror of the Nazi regime increased more regularly between 1933 and 1942, when it reach its apex. As a journalist, I wanted to tell this story in a powerful way and decided to visualize the number of victims of Nazi Germany month by month on a line chart.
After Google failed to give me a lead, I asked Peter Haber for advice, who referred me to his colleagues. It turned out that there is no month by month data of victims of Nazi Germany available. Simon Erlanger even pointed out that not all victims are known. New details just emerged about 1,100 Jewish ghettos.
With that in mind, I set out to design a prototype for a data store that could handle data on a variety of scales, from macro to individual data, allowing for the concurrent use of data of different precision and reliability. To give an example, we know that about 1,1 million people were murdered at Auschwitz over the course of 55 months between 1940 and 1945: 20,000 monthly deaths. The accuracy of this figure is obviously low. If one were to add a sub-event to it, such as the 8,000 French Jews deported there in July 1942, the monthly number of victims would be 27,800 for July 1942 and 19,800 for all other months. This iterative process can be repeated until sub-events reach the scale of individual victims.
Working on different scales at the same time, we can store data about individuals as well as rough estimates for larger events. Using a graph database, we can describe victims on an ad hoc basis (e.g. we might have the age of some victims, but not all), using what is available. The very early prototype is called Europe Body Count (inspired by the Iraq Body Count project, considered to be the most reliable source of information about civilian deaths in Iraq). It is highly unstable and incomplete, but it makes the concept clear.
It is important to tell non-historians that Nazi Germany did not become gradually murderous but that massacres changed in magnitude in mid-1941. It is important because it explains why democracies did not get tougher on Hitler earlier on. It is important because, as survivors die (1942’s 20-year-olds just turned 90), we need facts more than ever.
National and ethnic narratives have failed at explaining what happened. If you only know that 6 million Jews were slaughtered in camps, you probably think (as a solid share of the European population does) that they were quite naive and afraid to fight back. Add the context of a more widespread bloodbath in the region and it becomes more understandable. If you only take the 500,000 Germans who died between 1944 and 1946 as they were expelled from eastern regions of Germany, it looks outrageous. Add the context of years of massacres and slave labor and the German plight appears as within the bounds of normality in those years in the region.
A comprehensive database, an excellent API and good-looking visualizations won’t transform Europeans in critical historians. But it will give tools to those journalists and story tellers who want to fight back revisionist narratives. As survivors die, we’ll need that more than ever.
